

Sub-hourly historical weather data, or historical weather data with minute-by-minute resolution can be retrieved by users of the weather API. Please see the weather data editions page for details on which weather API plans include sub-hourly data access.
Requests for sub-hourly data mirror the same requests for hourly or daily uses however there are some additional parameters and considerations when requests detailed, minute level data.
For a general overview of sub-hourly weather, read our recent blog.
Quick start to creating sub-hourly weather data requests
To request subhourly weather data, replace the current ‘aggregateHours’ parameter with ‘aggregateMinutes’
aggregateMinutes – the time intervals to retrieve weather data. It is generally recommended to retrieve data using a factor of 60 minutes so that the times repeat for each hour. For example, 5, 10, 15 or 30. Intervals less than 5 minutes are not typically useful as weather stations do not update that frequently and the output will be of an excessive size.
combinationMethod – how to combine multiple station data into a single records. Permitted values include aggregate (the default), best and list.
stationTypes – A filter of the source of the data. Permitted values include mesonet, metar, metarhf and isd. Multiple values can be specified by concatenating the values with a pipe (|) symbol.
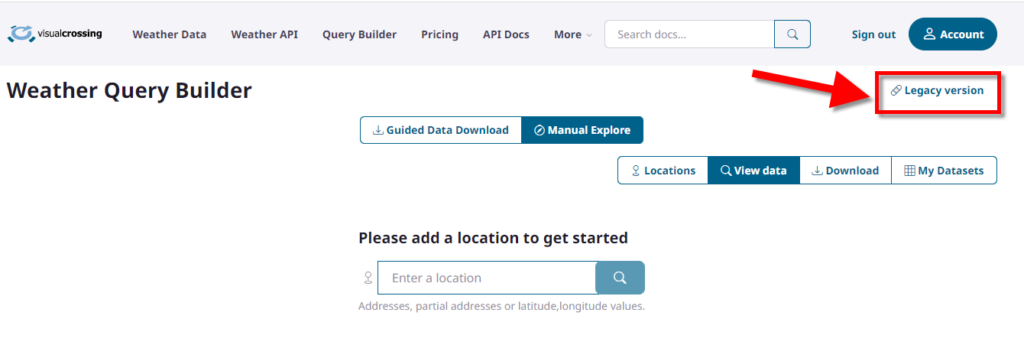
NOTE – Sub Hourly Queries are currently only available in the legacy API. To access the web GUI for the legacy API log in on the Visual Crossing Site and click the ‘legacy API’ link in the upper right corner.
Loading sub-hourly data in Weather Data Services Page
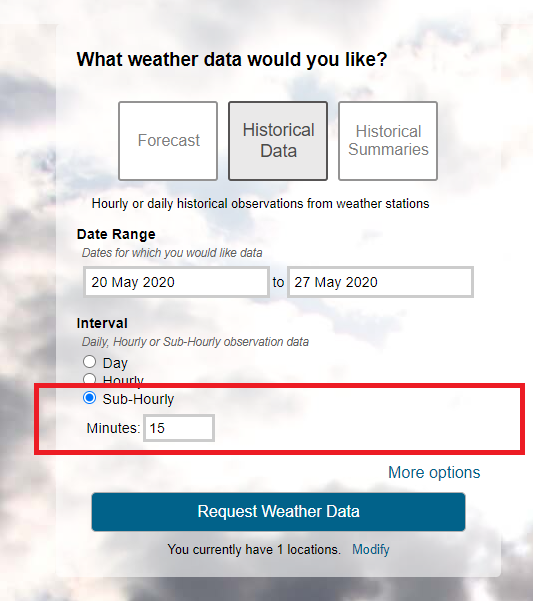
When you have an account that includes sub-hourly access, you will see additional options in the Weather Data Services historical data request build page.
Choosing ‘sub-hourly’ will construct a request with the aggregateMinutes parameter set according to the minutes drop down. It is recommended that the minute value be set to a factor of 60 minutes to avoid confusing results. In this case the drop down guides you to choose a multiple of 5 between 5 and 30 minutes.
The combination method can also be chosen (see below for details).
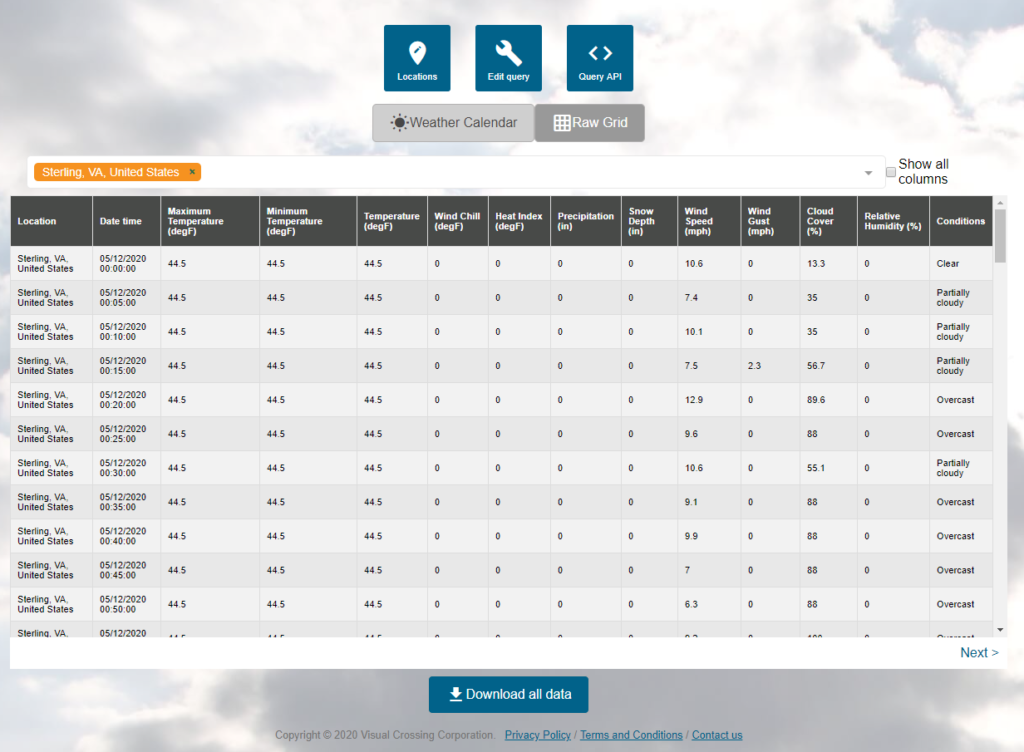
Once you have constructed your sub-hourly request, you can view the data in the browser, download the data as a CSV or export the Weather API request definition.
Loading sub-hourly data in Weather API Requests
The following example retrieves the weather data for Sterlina, Virginia, USA for the April 30th 2020 using 15 minute intervals.
https://weather.visualcrossing.com/VisualCrossingWebServices/rest/services/weatherdata/history?
combinationMethod=aggregate&aggregateMinutes=15
&startDateTime=2020-04-30T05:30:00&endDateTime=2020-05-01T07:00:00&collectStationContributions=true&maxStations=3&maxDistance=-1&includeNormals=false&contentType=csv&unitGroup=metric&locationMode=single&key=YOUR_API_KEY&locations=Sterling%2C%20VA%2C%20US
Understanding sub-hourly weather data requests
Just as weather history data could be requested at the hourly or daily, detail level, sub-hourly requests can also request data for a set interval, such as five minute or fifteen minute.
When the data is requested, the weather API identifies the most relevant weather data within each fixed interval and aggregates the records to a single record most that represents the expected weather observations based on the surrounding weather stations. As with the hourly and daily requests, stations that are closer in distance are weighted as more important than those further away.
As the interval of individual weather station sub-hourly reports varies significantly, stations that have reported more closely to the interval time will be weighted more than those further way.
Consider the following minute weather observations:
Station A - 9:07am, 9:17am, 9:27am
Station B - 9:00am, 9:15am, 9:30am
As you can see, individual weather stations do not report minute level data on a fixed schedule. Unlike hourly data, where observations are reported on a generally agreed schedule to represent the past hour, sub-minute data is reported in a much more adhoc manner. Visual Crossing Weather Data will normalize and aggregate these readings into consistent reports so that it’s easy to look up sub-hourly weather data on the required schedule.
Given the above observations, let’s request weather data on a 5-minute interval. We will expect to see data at these times:
Report - 9:00am, 9:05am, 9:10am, 9:15am, 9:20am, 9:25am, 9:30am
Only a small number of the actual station observations align with the data we have requested. To assign values to every 5 minute period we use the following logic:
Step 1 – assign actual observations to the corresponding time period based on the closest time period:
9:00am - Station B 9:00am
9:05am - Station A 9:07am
9:10am
9:15am - Station A 9:17am, Station B 9:15am
9:20am
9:25am - Station A 9:27am
9:30am - Station B 9:30am
As you can see, this results in a mix of periods. Some have two observations, some have one and some of the have none. This will depend on the available stations for a particular location.
To solve this problem. We interpolate records so that we have a complete picture without any gaps.
Step 2 – Ensure all time periods have periods from both stations.
9:00am - Station B 9:00am, Station A*
9:05am - Station A 9:07am, Station B*,
9:10am - Station A*, Station B*,
9:15am - Station A 9:17am, Station B 9:15am
9:20am - Station A*, Station B*,
9:25am - Station A 9:27am, Station B*
9:30am - Station B 9:30am, Station A*
Where records indicated by an asterix (*) are records that are calculated from other observations from the same station.
Step 3- apply weighted interpolation to each time period.
Now that every time period has a reading from every station, we can apply the weighted interpolation for each time period. This weighting will assign a higher weight to records that are closer to the requested location.
Requesting raw observation data
The above aggregation algorithm calculates the best estimate of the weather records based on consistent time periods such as 5, 10 or 30 minutes. If you would like to retrieve raw records without interpolation, you can use the combination method parameter to retrieve the observations.
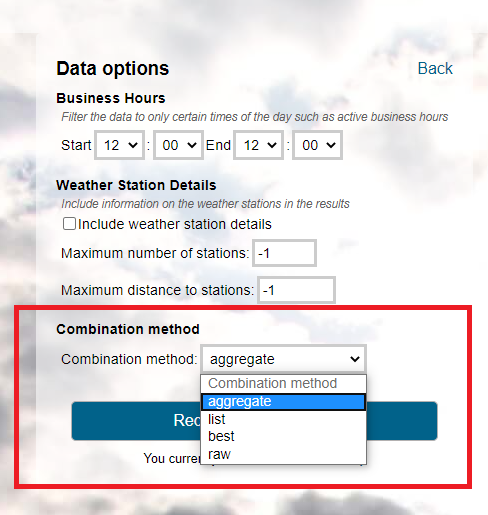
There are four values:
aggregate – retrieves the interpolated, consistent data described in the previous section.
best – retrieves the top observation in any single time period. The best records is based off the combination of the time since the observations and distance to it. Distance is weighted more highly than timeliness. So far example, a record that is 1 mile away from 10 minutes ago, is considered better than a record that is 10 miles away from 5 minutes ago.
list – retrieve the top observations for each of the requested time periods. The list is the top stations ordered by the same weighting as ‘best’ above. The maximum station count will dictate how many observations are returned in each time period.
raw – retrieve all observations and do not combine or filter them at all. The observation date-times will remain as reported by the weather station.
For both ‘best’ and list, output options, no interpolation is done and so some periods will have different numbers of observations than others. In addition some records such as precipitation will not be processed as they are in the aggregated output. All values will be indicate the raw weather metric values as reported by the weather station in question.
Questions or need help?
If you have a question or need help, please post on our actively monitored forum for the fastest replies. You can also contact us via our support site or drop us an email at support@visualcrossing.com.