


Historical Data
More than 50 years of global weather history


Access a range of data from high-quality government sources, complete and ready for loading into any application or system. Our datasets include historical data and forecast data, with 7-day, 15-day, and monthly forecasting options available.
Data is available at hourly and daily granularity, with interpolated local environmental information to help fill gaps between observation points and provide location-specific insights. Core weather parameters include temperature, humidity, precipitation, and cloud cover, along with wind and solar data for energy production and marine forecasting for coastal and offshore planning. For agriculture and land-based operations, available data also includes degree days and soil temperature for agribusiness, helping support crop planning, risk monitoring, and operational decisions.

Use weather measures such as temperature, precipitation, wind, humidity, UV Index, and more for all of your weather analysis needs.

Understand how solar radiation conditions such as GHI, sun elevation, and diffuse radiation affect energy production from the sun.

Manage your agricultural activities using advanced elements such as soil temperature, soil moisture, and evapotranspiration.

Analyze wind speed and directions at heights from 10 meters to 100 meters for use in wind power projects and aviation.

Plan activities on the shore and at sea including surfing and shipping using wave height and swell conditions.

Monitor the air quality conditions in any location to see how they affect human health, livestock, or sensitive equipment.

Calculate how heating and cooling periods affect farm and garden planting, sowing, growing, harvesting, HVAC planning and more.

Track sunrise, sunset, phases of the moon, and more for use in planning outdoor activities such as hunting, fishing, and stargazing.

Receive severe weather alerts for impending storms, floods, and other important weather events.
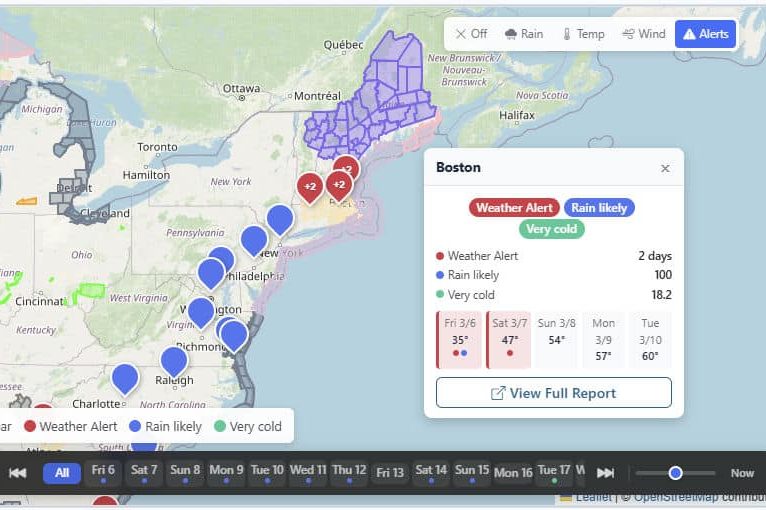
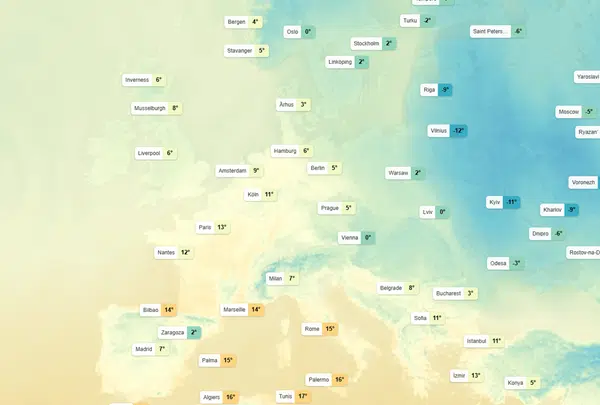
Visual Crossing provides global coverage for full 15-day, worldwide weather forecasts and ultra-long-range forecasting using high-quality government sources and statistical climate modeling.
Our tools cover standard measurements like rain and wind or weather alerts, as well as specialized forecasting like solar radiation, degree days, and wind speed.
These comprehensive resources are available via our web-based data explorer page and the Weather Timeline API. Users can enjoy 99.9% uptime along with low latency and streamlined integration.

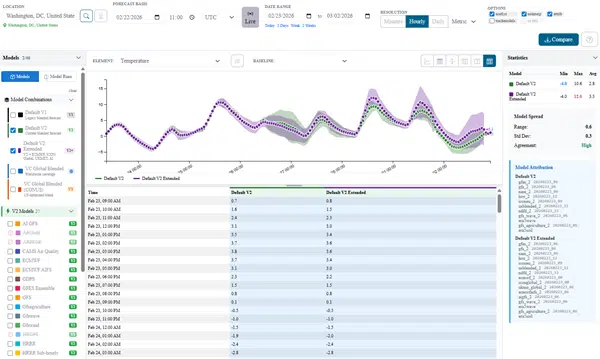
Our powerful Weather Query Builder makes downloading weather data and building API queries simple. Create API-ready requests, generate sample code, and use AI-assisted tools to turn raw weather data into insights that drive smarter, faster decisions.

Navigate to the Visual Crossing Weather Query Builder

Enter the place or area you want weather data for

Select a single date or a date range for your query

Generate the request and fetch the weather results
Download the data or retrieve via API in JSON or CSV format

Pique your customers’ interest and spur impulse orders by integrating real-world conditions into your advertising strategy.

Build, filter, and export massive weather datasets in seconds without writing a single line of code. Perfect for business users and analysts who need reliable, ready-to-use data.

Improve productivity, protect your investments, and prevent costly delays through local, minute-by-minute forecasting.

Optimize construction timelines and improve resource management with detailed forecasting at any address.

Prevent fraud by verifying insurance claims based on hyperlocal weather maps.

Optimize routes, protect cargo, and prevent delays with our global coverage.
The Visual Crossing global weather database provides easy access to decades of national and global sources, model-based 15-day forecasts, and long-range patterns based on statistical climate modeling. This allows our weather engine to quickly and easily provide the inputs that you need for any project worldwide.
Our engine processes billions of hourly and sub-hourly observations from more than 100,000 worldwide observation stations, including satellite and maritime sources, to create our global observation database. Every report is analyzed for errors, missing information, and other anomalies to ensure that the most complete reports are retained.
The engine then aggregates and interpolates from these records to create the most accurate report for any place at any time in the past 50 years. This enables you to view historical reports at whatever locations and resolutions you need to satisfy any project. Whether you need historical weather data by ZIP Code or climate data by address, our vast archive has the data that you seek. As a response to a single query, our engine can combine hundreds of local station records to produce a single, coherent report for anywhere in the world.
Our 15-day forecast is generated using detailed models from leading sources such as NOAA and the DWD. This ensures global coverage in every city and address your project may need. Our weather forecasts offer hourly detail and overall summaries for a full 15 days. For projects that need even longer-range forecasts, our climate-based forecasts provide norms and patterns for any date of the year. Our weather API provides a range of specialized data for any industry or use case, all sourced from high-quality datasets and cleaned for immediate implementation. The AI Code Builder and desktop Query Builder are designed to simplify API implementation, ensuring a seamless experience for developers.
With the novel Timeline LLX Weather API, users can enjoy fast, high-concurrency responses, crucial for lightweight mobile IoT applications. Choose JSON, CSV, or FlatJSON for mobile and IoT applications.
Despite this power, Visual Crossing Weather is the easiest and most accessible service available, with both free and paid options. Access is available through our web-based data explorer page, data science integrations, and Weather API. How-to articles, videos, and code samples are available for many business and analytical tools as well as most programming languages.
Weather is daily conditions, while climate refers to general trends over a long period, such as years or even centuries. Climate data can help identify what conditions will be like in a given week and how trends are changing over time.
Readings are gathered from observation stations across the planet, which is then fed back to services like NOAA and DWD. We then make this available through our API for consumers and businesses.
Common organizational uses include:
Our support team is available to answer questions about how to integrate weather data into your daily operations.
Meteorologists employ a variety of tools, such as thermometers, barometers, radar, satellite observations, wind vanes, and weather balloons. These are all collected and run through statistical analysis to identify the possibility of different events.
Certain events, like tornadoes, hurricanes, major snowstorms, large hail, or major thunderstorms, may cause property damage or risk to human life.
Information about these events is collected through station recordings, satellite or radar measurements, and reports from professional storm chasers. These individuals and organizations will follow extreme events to gather up-close information about formation, size, and severity. They may use reinforced cars or airplanes with specialized equipment, then submit this information to organizations like the National Weather Service.
Humidity is a condition on a certain date, though it also factors into climate information to identify the average humidity throughout the year.
Snow is one of the most difficult conditions to predict because it involves several different factors. Ground and air temps, moisture, and humidity all factor into the total snowfall in a given area, and even advanced computer models struggle to predict the depth and timing.
In addition, forecasting becomes less precise the further into the future one is trying to predict, which is why long-range forecasting is based more on historical averages.
Wind speed is typically measured using an anemometer and may be displayed using wind barbs. Wind direction is measured relative to a 360-degree compass.
A weather API can be a valuable tool for businesses and organizations that need real-time access to scalable, reputable data for quality decision-making. It is especially valuable for automating processes, such as tilt adjustments on solar farms, triggered advertising, or public safety alerts.