




How does a weather risk monitor differ from a standard weather forecast tool?
Multi-site Weather Monitoring Software for Risk Management
Multinational corporations, franchise companies, logistics companies, and other businesses with a global footprint need to monitor weather impacts across multiple locations. With the Multi-Site Weather Risk Monitor, your team can view 15-day forecasts, define custom safety thresholds, and automate risk alerts for every tracked region in one view. This streamlines operational risk assessments while preventing costly delays.
Stop checking forecasts. Start managing risk.
Standard weather apps require manually checking individual cities. While this is useful for the everyday person, it can lead to missed insights and costly delays for organizations that are spread across a larger geographic area.
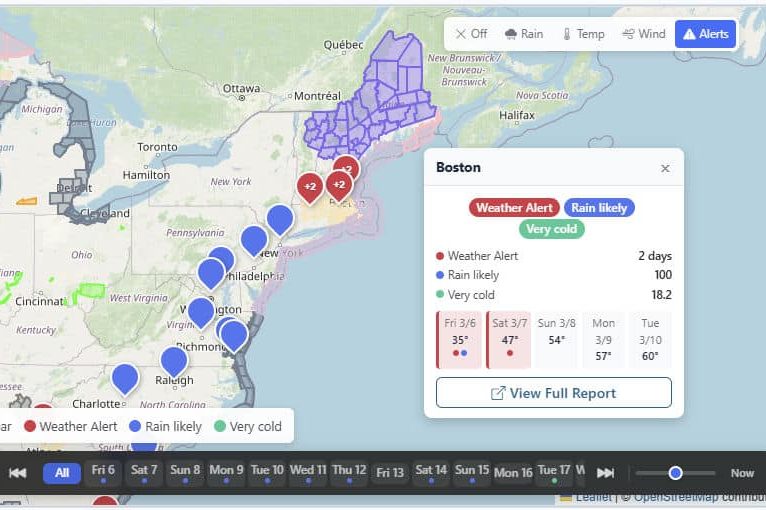
Instead of manually checking individual cities, you can track real-time and forecast data for thousands of places from one centralized system. Alerts for every tracked place will appear in one place, letting you address immediate safety issues while assessing elevated risks in other places. This ensures you can make informed time-based decisions, such as work stoppages or reroutes, without unnecessarily impacting other worksites.
This is invaluable for construction, outdoor events, logistics, and retail. Whether it’s wind speeds for crane safety, temperature floors for concrete pouring, or lightning risks for outdoor events, you get a color-coded bird’s-eye view of your entire organization’s weather risk.

Multi-Site Monitoring
Monitor thousands of global sites simultaneously with a centralized dashboard.

Custom Thresholds
Set critical weather parameters for any weather element that can provide risk to your sites.

Hyperlocal Forecasts
Instantly identify site risk indicators that visualize and animate where weather threats currently exist and where they are headed.

Risk Maps
Instantly identify site risk indicators that visualize and animate where weather threats currently exist and where they are headed.

Weather Alerts
View high-priority alerts issued by national and local agencies for situational awareness

Team Sharing
Seamlessly integrate risk data into your team workflows via our scheduling and sharing capabilities.
Key Features of Weather Risk Monitor
Rather than constantly updating a weather dashboard with manual inputs, Multi-Site Weather Risk Monitoring enables you to continuously track conditions over time and across regions. Each input is presented with the date, time, and type of warning, color-coded for convenience. This user-friendly dashboard enables people to see emerging weather situations at a glance.
The Visual Crossing API aggregates data from high-quality sources like the National Oceanic and Atmospheric Administration (NOAA), the European Centre for Medium-Range Weather Forecasts (ECMWF), and the UK Met Office. This information is synthesized and presented with easy color coding. To see more details, simply click any address to review available warnings, such as a severe thunderstorm watch.
Location Management
The dashboard is built to support distributed operations, allowing you to input thousands of places across regions. This scalability means that you can continue to monitor warnings as your operations grow.
The system accepts latitude/longitude coordinates, city names, full addresses, or postal codes. They can be added manually, pasted from a clipboard, or uploaded from a CSV file.
Once the data has been imputed, it will be displayed on a map, with the specific address as the marker. However, you can assign each address a custom name, such as “Chicago Department” or “Downtown Omaha,” so that you can identify the specific place at a glance.
Risk Criteria and Thresholds
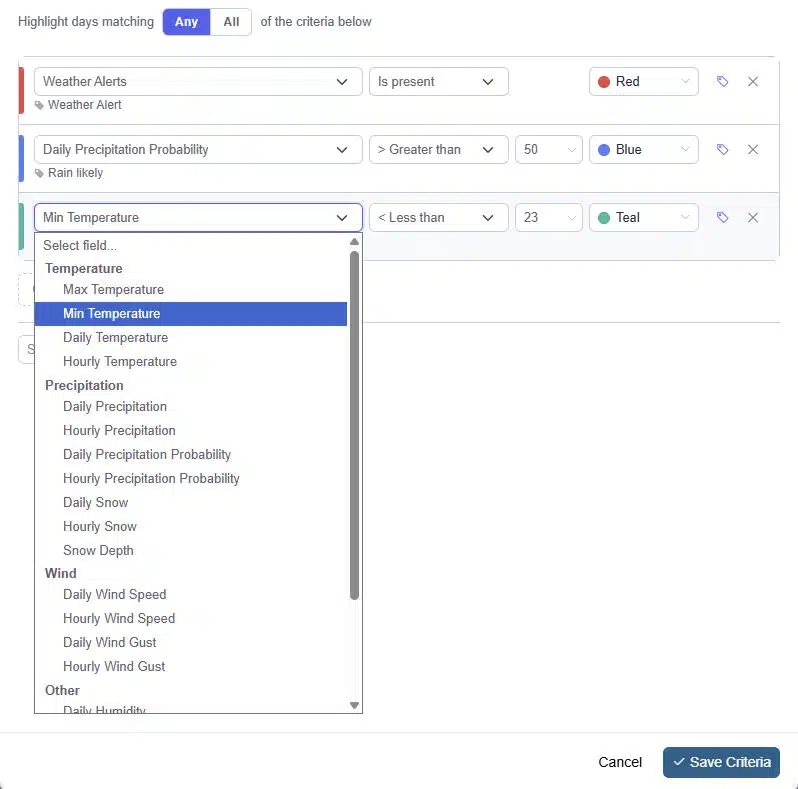
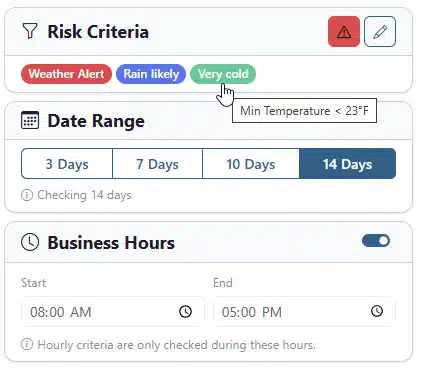
You can tailor the weather fields to parameters like temperature, precipitation, wind speed, humidity, and severe risk levels. With the Criteria Editor, you can define specific operators, like “greater than” or “between,” then assign distinct colors to certain types.
For example, a severe thunderstorm warning for a tri-county area may trigger alerts across that region, allowing you to immediately contact your employees in that area and adjust operations. Wind speeds above 20 miles per hour along a shipping route could be another alert that helps you get truckers out of harm’s way.
The tool also has industry presets, based on the typical needs of sectors like construction. This lets you instantly set up thresholds, then modify them depending on your specific operations.
Advanced Filtering and Scheduling
Different alerts describe the risk of certain events, like severe storms. A forecast indicates the chance of rain, an advisory warns of a heightened risk of thunderstorm activity, and a warning notes an immediate threat. The system will automatically refresh according to your automated scheduling, ideal for teams that need information at a specific time of day.
With user-defined thresholds, you can decide which alerts to display on the dashboard. For example, you can filter for business hours, like an 8:00 AM to 5:00 PM work shift. You can also use KPI Filter Cards, which narrow the dashboard to only the selected parameters. This may be “Any Risk,” “No Risk,” or a specific threat
Interactive Visualization Modes
Visualization modes allow users to quickly identify affected regions, ensuring faster decision-making. Granular toggle switches let users switch between daily and hourly views to assess the timing of a forecast and its expected duration.
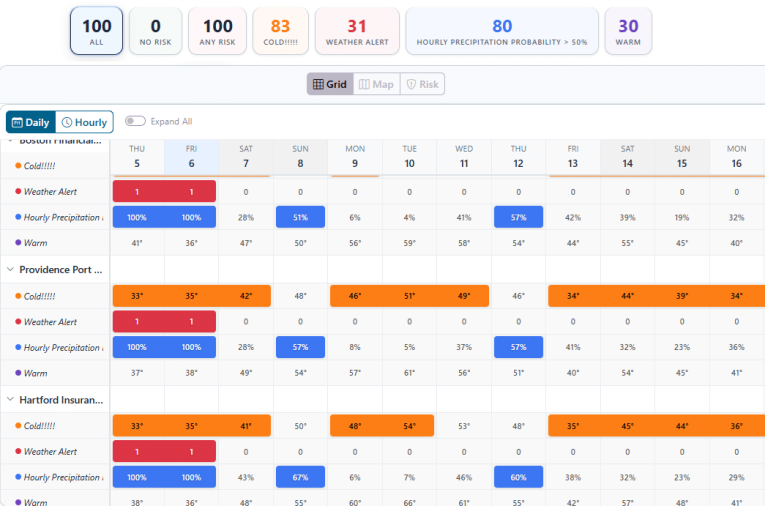
The Grid View provides a matrix of locations and dates, color-coded for the specific risk threshold. With the interactive map view, users can check color-coded markers at a glance or add overlays for precipitation, temperature, and wind.
Weather Intelligence Built for Your Industry

Logistics & Shipping
Logistics teams can review the entire route at a glance, assessing for common threats such as heavy rain, snow, high winds, extreme heat, or severe storms. This allows for real-time rerouting, delayed dispatch, or adjusted scheduling based on the specific cargo and potential threat.
For example, a trucking company may be transporting temperature-sensitive food. Dispatchers can use visualizations to overlay temperature maps along the route, identify potentially dangerous temperature conditions, and advise on alternative routes. If severe weather emerges, dispatch can reroute, adjust departure times, or stage inventory at distribution centers.
This proactive monitoring improves safety, retail relationships, and profit margins without adding unnecessary friction like manually checking routes.
Construction
The Multi-Site Weather Risk Monitor is crucial for large construction companies that have crews working simultaneously at multiple job sites across a region.
Project managers can use forecast data, severe weather alerts, and short-term precipitation insights to adjust work windows or reassign tasks across the whole region. High winds or thunderstorms may affect one job site, meaning heavy equipment can’t be operated and workers at height have to come down. Meanwhile, another site is unaffected. Instead of shutting down operations across the entire region, managers can reallocate tasks between sites.
Consider a highway paving project in the summer. Pavement quality is highly sensitive to both temperature and precipitation: unexpected rain can ruin freshly laid asphalt, while extreme heat affects both curing and worker safety.
Project managers note a precipitation alert at one work site expected to last most of the day, but another site has optimal curing conditions and a comfortable temperature. Project managers can adjust work windows to prioritize asphalt laying at one site while scheduling alternate tasks, like grading, equipment maintenance, or staging materials, at the affected site.

Energy & Utilities
Weather affects demand forecasting, crew deployment, asset protection, and service reliability, but risks are not evenly distributed across an entire service region. Identifying ZIP codes or neighborhoods most likely to experience severe weather enables utility companies to predict demand spikes, power outages, and infrastructure damage, so they can swiftly respond to changing conditions and reduce interruptions.
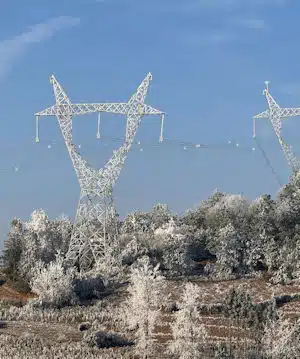
Assume a regional electric utility has been notified of an approaching winter ice storm. However, the visualization tool shows that only the eastern half of their service area is likely to experience heavy icing and high winds. Instead of spreading repair crews over the entire area, the utility can deploy most of its assets to the east side, including staging replacement equipment and coordinating with emergency response agencies before the outages begin.
The utility can also assess demand forecasts and prioritize generation capacity for the most urgent needs, like hospitals, emergency shelters, and public service buildings. This helps the utility restore service more quickly and maintain stability across the electrical grid, reducing damage to vital infrastructure.
Retail & Facilities
Weather affects customer traffic, staffing, inventory planning, and site readiness, so a multi-region company needs to consider how to allocate resources based on changing conditions at each store.
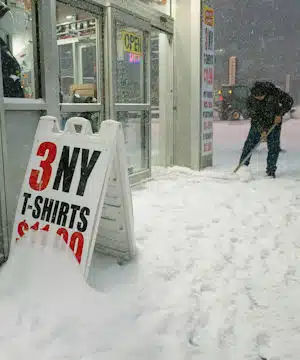
Assume a regional retail chain has been alerted to a winter storm that will arrive next week, with its epicenter near the middle of their service area. While all stores will need to increase inventory for ice melt, shovels, and winter clothing, staffing will need to be adjusted; stores in whiteout conditions are likely to see both lower foot traffic and higher staff callouts. Regional management may choose to notify customers that certain stores will close and redirect them to stores that are likely to be less affected. Meanwhile, facilities teams can coordinate with snow removal contractors to prepare parking lots and walkways for icy conditions.
Ready to eliminate weather blind spots?
Join thousands of businesses using Visual Crossing to protect their operations.
Already a Visual Crossing Subscriber?
During the preview release, Weather Risk Monitor is included in all plans. Start building your Risk Monitor today to take your Operational Weather Intelligence to the next level!
FAQs about Weather Risk Monitoring
A risk monitor enables companies to review current conditions and warnings for thousands of places worldwide rather than manually checking conditions in a single spot.
Yes, this is one of the system’s primary benefits. Users can determine which severe weather conditions to track and set up color-coded warnings based on the conditions most likely to impact their operations.
Conditions that can trigger risk alerts include extreme temperatures, heavy precipitation, lightning, high wind speeds, thunderstorms, or potential natural disasters such as tornadoes.
The API pulls warnings from trusted sources like the NOAA and pins them to the specific tracked address, which then appear with a risk category. You can decide what types of alerts to show and color-code them for easy review at a glance.
Logistics and shipping, construction, utilities, emergency response, event planning, and retail organizations all use multi-site monitoring systems to manage resources, adjust scheduling, and ensure prompt response to emerging conditions.